Case studies, not promises.

Case studies from the workflow

Selected chart examples from the dashboard, shown for education. Not typical results and not a forecast.

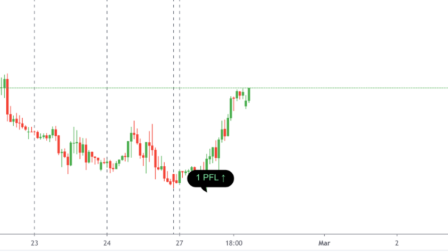
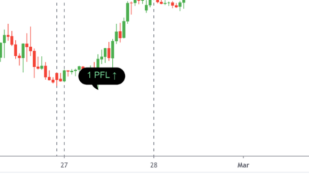
Silver chart from the ForexScalper dashboard with a trend signal marker (cropped screenshot, shown for education)

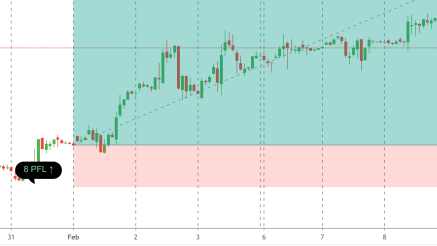
Setup examples from the dashboard. Selected, and shown for education.

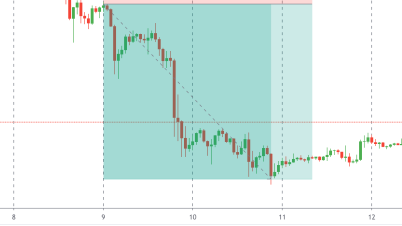
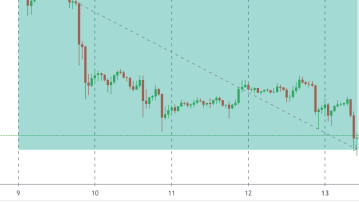
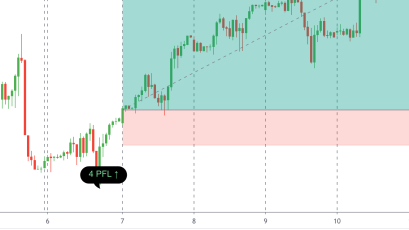
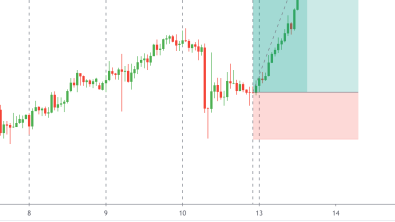
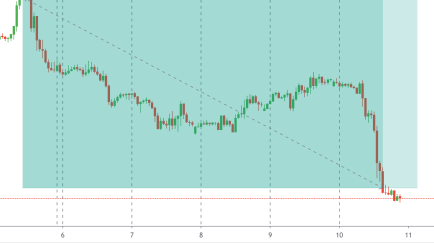
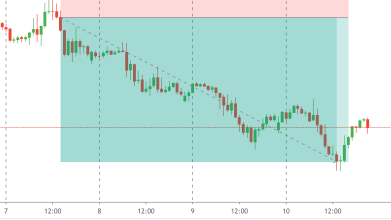
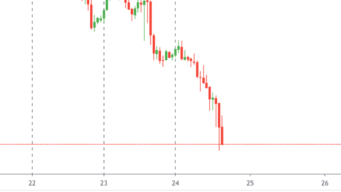
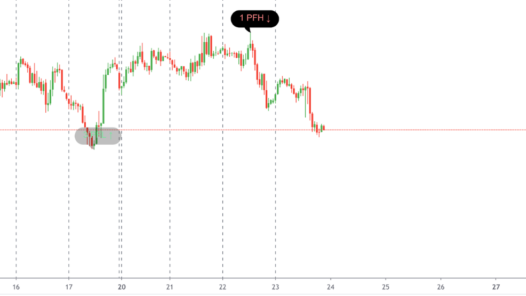
Cropped chart screenshots from the ForexScalper dashboard showing where a signal was flagged and the zone it mapped. These are selected examples, not typical results and not a forecast: many signals do not reach their zone, and losses occur.

Featured trade
GBPNZDSummo ↓
Before and after

Algorithm: FSB Breakouts + Trend Detection

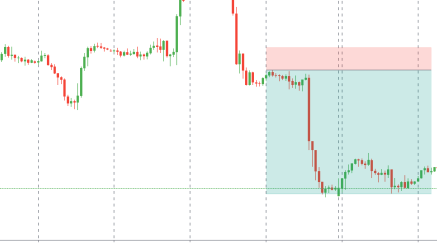
Left: the chart when the dashboard flagged the signal. Right: the same chart later on. One selected example, shown for education — not every signal plays out this way, and losses occur.
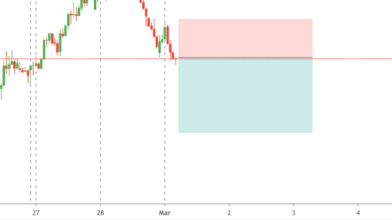
GBPNZD · the chart when the signal was flagged
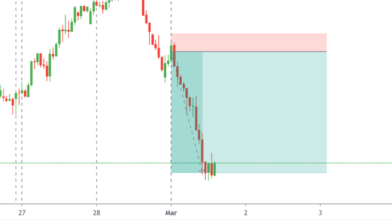
Before · signal flagged
GBPNZD · the chart when the signal was flagged
GBPNZD · the same chart, later
After · same chart, later
GBPNZD · the same chart, later
XAUUSD chart · dashboard signal example
XAUUSDSummo ↓
Selected example

Gold · the signal and the zone the dashboard mapped, viewed after the fact.

XAGUSD chart · dashboard signal example
XAGUSDSummo ↓
Selected example

Silver · where the dashboard flagged the signal, viewed after the fact.

GBPCAD chart · dashboard signal example
GBPCADSurge ↑
Selected example

GBPCAD · where the dashboard flagged the signal, viewed after the fact.

BTCUSD chart · dashboard signal example
BTCUSDSummo ↓
Selected example

Bitcoin · the signal and the zone the dashboard mapped, viewed after the fact.

ETH chart · dashboard signal example
ETHSummo ↓
TSLA chart · dashboard signal example
TSLASurge ↑
Brent chart · dashboard signal example
BrentSurge ↑
GBPJPY chart · dashboard signal example
GBPJPYSurge ↑
EURCAD chart · dashboard signal example
EURCADSummo ↓
EURGBP chart · dashboard signal example
EURGBPSummo ↓
GBPCAD chart · dashboard signal example
GBPCADSurge ↑
XAGUSD chart · dashboard signal example
XAGUSDSummo ↓

How the rules get tested.
A drawing, not results.

The FSB rules are run over past charts in TradingView's strategy tester before they reach the dashboard. A backtest is hypothetical: it shows how fixed rules would have behaved with hindsight, not what anyone earned. That is why this page shows an illustration instead of backtest numbers.

How a signal is markedIllustration · not market data

Hypothetical performance disclosure

These results are based on simulated or hypothetical performance results that have certain inherent limitations. Unlike the results shown in an actual performance record, these results do not represent actual trading. Also, because these trades have not actually been executed, these results may have under- or over-compensated for the impact, if any, of certain market factors, such as lack of liquidity. Simulated or hypothetical trading programs in general are also subject to the fact that they are designed with the benefit of hindsight. No representation is being made that any account will or is likely to achieve profits or losses similar to these being shown.

Built around a member Discord.
Daily calls. A course. A place to journal.

Members post their own setups, questions, and trade journals in the community. Individual experiences shared there are not typical results and not a forecast. Trading involves risk of loss.

Join the Discord →
Signal fires → plan → journalFSB Surge + FSB Summo · one dashboardFSB community sectionFSB courseRisk plan before every tradeSignal fires → plan → journalFSB Surge + FSB Summo · one dashboardFSB community sectionFSB courseRisk plan before every trade

Membership starts here.
Get full access to the platform.

New members can start with $3 for 3 days. Pick the plan that best matches your trading cadence.